

Measuring the
Economic Health State (EHS)
in the Euro Area
Introduction
A measure of the citizens’ perception about the "Economics Health State" (EHS) for the countries of the Euro Area in the period 2005-2015 has been obtained using the MIMIC-CUB Model (Carpita et al., 2016).
The approach is composed by the following two steps.
- 1st step: the Combination of Uniform and shifted Binomial (CUB) Model is used to estimate two multiple indicators with
the Eurobarometer Public Opinions Survey data (Nissen, 2014) about the economic situation. In particular, two times each year to samples of citizens of the
27 EU countries, the following two questions are asked:
How would you judge the current situation in each of the following?
$y_1$ - The situation of the (NATIONALITY) economy (NAT);
$y_2$ - The situation of the European economy (EUR).
Answers are on the ordinal scale: "Very bad", "Rather bad", "Rather good", "Very good". - 2nd step: the Multiple Indicators and Multiple Causes (MIMIC) Model is used to measures the influence of the multiple causes,
that are the forecast news about the national economics, on the EHS. In particular, bi-annual country data has been collected from the Economic Forecast
reports spread by the Directorate General for Economic and Financial Affairs (DG ECFIN) on behalf of the European Commission.
The chosen economic indicators are the following:
$x_1$ - Gross domestic product per capita (GDP);
$x_2$ - Unemployment rate (UNEMP);
$x_3$ - Harmonised Index of Consumer Prices (HICP);
$x_4$ - Gross Debt, general government as % of GDP (DEBT).
1st Step: The CUB Model
Quantification of ordinal variables has a long history in methodological research, related to the nonlinear multivariate analysis (Carpita and Manisera, 2012),
and the CUB Model has been introduced in the statistical literature by D'Elia and Piccolo (2005) to analyse ordinal (rating or ranking) data and extended in various directions (Manisera and Zuccolotto, 2014).
With the CUB Model, data are modelled by a mixture of a Shifted Binomial and a discrete Uniform random variables.
In practice, the observed rating r is a realization of the discrete random variable R with probability distribution:
with $r=1, 2, \ldots, m$, $\pi \in (0,1]$ and $\theta\in [0; 1]$. The trial parameter $m$ and the success probability $y = (1 – \theta)$ of the Shifted Binomial random variable modelling the feeling component of a decision process, and the mixture parameter $\pi$ aimed to model the uncertainty component (Iannario and Piccolo, 2012; Oberski and Vermunt, 2015). In this study we obtain the Maximum Likelihood estimate of the feeling parameter $y$ of the CUB Model (\ref{CUB}) for each of the EU27 countries of the bi-annual Eurobarometer Survey for each period from 2005 to 2015, quantifying the two citizen opinions, about the National ($y_1$) and European ($y_2$) economies respectively. These feelings are used as multiple indicators in the following step.
2nd Step: The MIMIC Model
This model (Goldberger, 1972; Jöreskog and Goldberger, 1975; Maltritz et al., 2012) is used to represents the relations between some observed indicators
or manifest variables (MVs) and some unobserved constructs or latent variables (LVs), and consists of two sets of equations:
\begin{eqnarray}
\mathbf{y} &=& \Lambda \mathbf{\xi} + \epsilon \label{mimic1}\\
\mathbf{\xi} &=& {\rm B} \mathbf{x} + \tau \label{mimic2}
\end{eqnarray}
where:
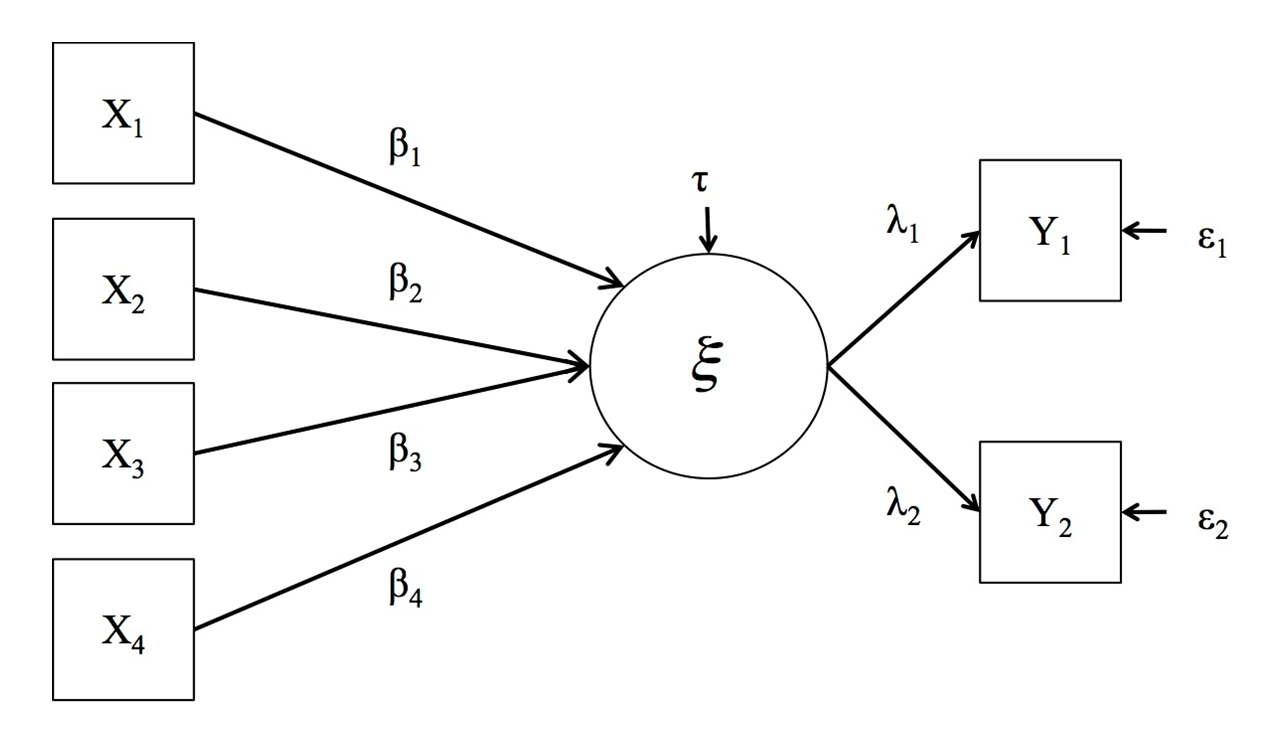
$\mathbf{y}$ is a $p$ vector of the MVs (multiple indicators) of the $s$ LVs in the vector $\mathbf{\xi}$;
$\mathbf{x}$ is a $q$ vector of the MVs (multiple causes) of the $s$ LVs in the vector $\mathbf{\xi}$;
$\Lambda$ and ${\rm B}$ are the matrices of coefficients that must be estimated;
$\epsilon$ and $\tau$ are the vectors of the disturbance terms.
In this study, equation (\ref{mimic1}) links the $p = 2$ citizens’ feelings about the National and European economic situation,
the multiple indicators denoted by y obtained from the Eurobarometer data using the CUB Model (\ref{CUB}), to the unobservable
citizens' perception of the EHS of the Euro area, denoted with $s = 1$ LV $\mathbf{\xi}$. Equation (\ref{mimic2}) models the dependence
of $\mathbf{\xi}$ as a function of $q = 4$ macro-economic variables obtained from DG ECFIN data, the multiple causes denoted by $\mathbf{x}$.
The graphical representation of the MIMIC Model is in the Figure 1.
The Partial Least Squares - Path Modeling (PLS-PM) algorithm is used to estimate the parameters of the MIMIC Model (\ref{mimic1} and \ref{mimic2}). In the PLS-PM framework (Esposito Vinzi et al., 2010), this model building procedure can be thought as the analysis of two conceptually different models. While the measurement model specifies the relationships of the MVs with their LVs, the structural model specifies the causal relationships among LVs.
Estimates of the EHS for the Euro area
The estimate of the parameters $\Lambda$ of the MIMIC-CUB Model (\ref{CUB})-(\ref{mimic2}) can be easily used to estimate the LV citizens' perception of the European "Economic Health State" (EHS). In particular, the PLS estimate of $\xi_5$ for each country is the average of the two multiple indicators $y_1$ and $y_2$ obtained with the CUB Model (\ref{CUB}), weighted with the PLS estimates of $\lambda_1$ and $\lambda_2$ of the MIMIC Model (\ref{mimic1} and \ref{mimic2}): \begin{equation} {\rm EHS} = \frac{\hat \lambda_1 y_1 + \hat \lambda_2 y_2 }{\hat \lambda_1 + \hat \lambda_2}. \label{EHS} \end{equation} The measure EHS can be used with others macroeconomic indicators for economic analysis: increasing (decreasing) values of this estimate is a statistical evidence of more positive (negative) perception of the citizens about the European EHS (Carpita and Ciavolino, 2016). An example of the result for EHS for six countries (on the left: France, Germany and United Kingdom; on the right: Greece, Italy and Spain) is in the Figure 2.
Notes about the dataset
The dataset contain for each of the EU27 countries and for each year and bi-annual survey (for example: 2014.1 and 2014.2),
the 4 macro-economic variables (GDP, UNEMP, HICP, DEBT), the 2 citizens' feeling variables (NAT, EUR) and the EHS variable.
The exceptions are the following:
- 2005.1-2 and 2006.1-2: analysis regards EU25 countries, Bulgaria and Romania excluded.
- 2005.2: Eurobarometer data for both questions are missing, and data of 2005.1 are used.
- 2007.1: Eurobarometer data for second question are missing, and data of 2007.2 are used.
- 2008.1: Eurobarometer data for both questions are missing, and data of 2008.2 are used.
Time series graphs
- Feeling about the current situation of the national economy (NAT)
- Feeling about the current situation of the European economy (EUR)
- Perception of the European Economic Health State (EHS)
- Feeling about the current situation of the national economy (NAT)
- Feeling about the current situation of the European economy (EUR)
- Perception of the European Economic Health State (EHS)
References
- Carpita M., Ciavolino E., Nitti M. (2016). The MIMIC-CUB Model for the Prediction of the Economic Public Opinions in Europe. SYRTO Working Paper: syrtoproject.eu.
- Carpita M., Manisera M. (2012). Constructing indicators of unobservable variables from parallel measurements. Electronic Journal of Applied Statistical Analysis, 5(3): 320-326.
- Esposito Vinzi V., Chin W.W., Henseler J., Wang H. (2010). Handbook of Partial Least Squares. Springer, Berlin, Heidelberg.
- Goldberger A.S. (1972). Structural equation methods in the social sciences. Econometrica, 40(6): 979-1001.
- Iannario M., Piccolo D. (2012). CUB models: Statistical methods and empirical evidence. In Kenett R.S. and Salini S., editors, Modern Analysis of Customer Surveys: 231-258. Wiley, N.Y.
- Jöreskog K.G., Goldberger A.S. (1975). Estimation of a model with multiple indicators and multiple causes of a single latent variable. Journal of the American Statistical Association, 70(351a): 631-639.
- Maltritz D., Buehn A., Eichler S. (2012). Modelling country default risk as a latent variable: a multiple indicators multiple causes approach. Applied Economics, 44(36): 4679-4688.
- Manisera M., Zuccolotto, P. (2014). Modeling rating data with Nonlinear CUB models. Computational StatIstics and Data Analysis, 78: 100-118.
- Nissen S. (2014). The Eurobarometer and the process of european integration. Quality & Quantity, 48(2): 713-727.
- Oberski D., Vermunt J. (2015). The CUB model and its variations are restricted loglinear latent class models. Electronic Journal of Applied Statistical Analysis, 8(3): 374-383.